|
Back to Annual Meeting
Epidemiologic Assessment of Facial Fractures Using the NSQIP Database
Kuylhee Kim, M.D.1, Ahmed M. S. Ibrahim, M.D.1, Pieter G. L. Koolen, M.D.1, Hani H. Sinno, M.D.,MEng2, Samuel J. Lin, M.D.1.
1Harvard Medical School/Beth Israel Deaconess Medical Center, Boston, MA, USA, 2McGill University, Montreal, QC, Canada.
Background:
Accidental trauma is one of the leading causes of death in United States. Facial fractures are commonly encountered cases for surgeons in the emergency room. The aim of this study was to assess nationwide epidemiology and complication rates of facial fractures as well as the impact of surgical specialty on facial fracture repair using the ACS-NSQIP (American College of Surgeons - National Surgical Quality Improvement Program) databases.
Method:
We performed a retrospective review of prospectively collected data from the 2005-2011 ACS-NSQIP databases using CPT codes to identify patients undergoing facial fracture repair. Epidemiology, postoperative complications, comparison between single and multiple facial fractures and surgical specialty were accessed. Chi-square tests or Fisher’s exact test were used for comparing categorical variables and t-tests for continuous variables.
Results:
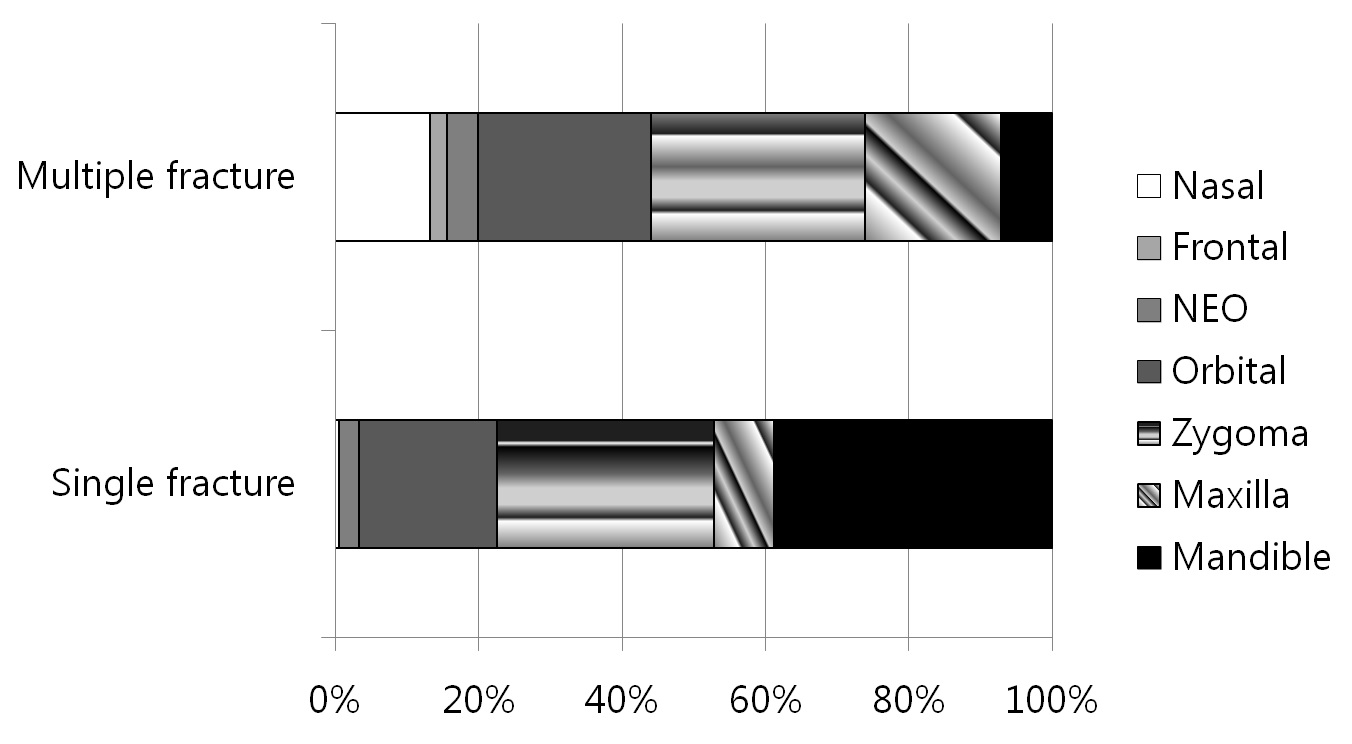
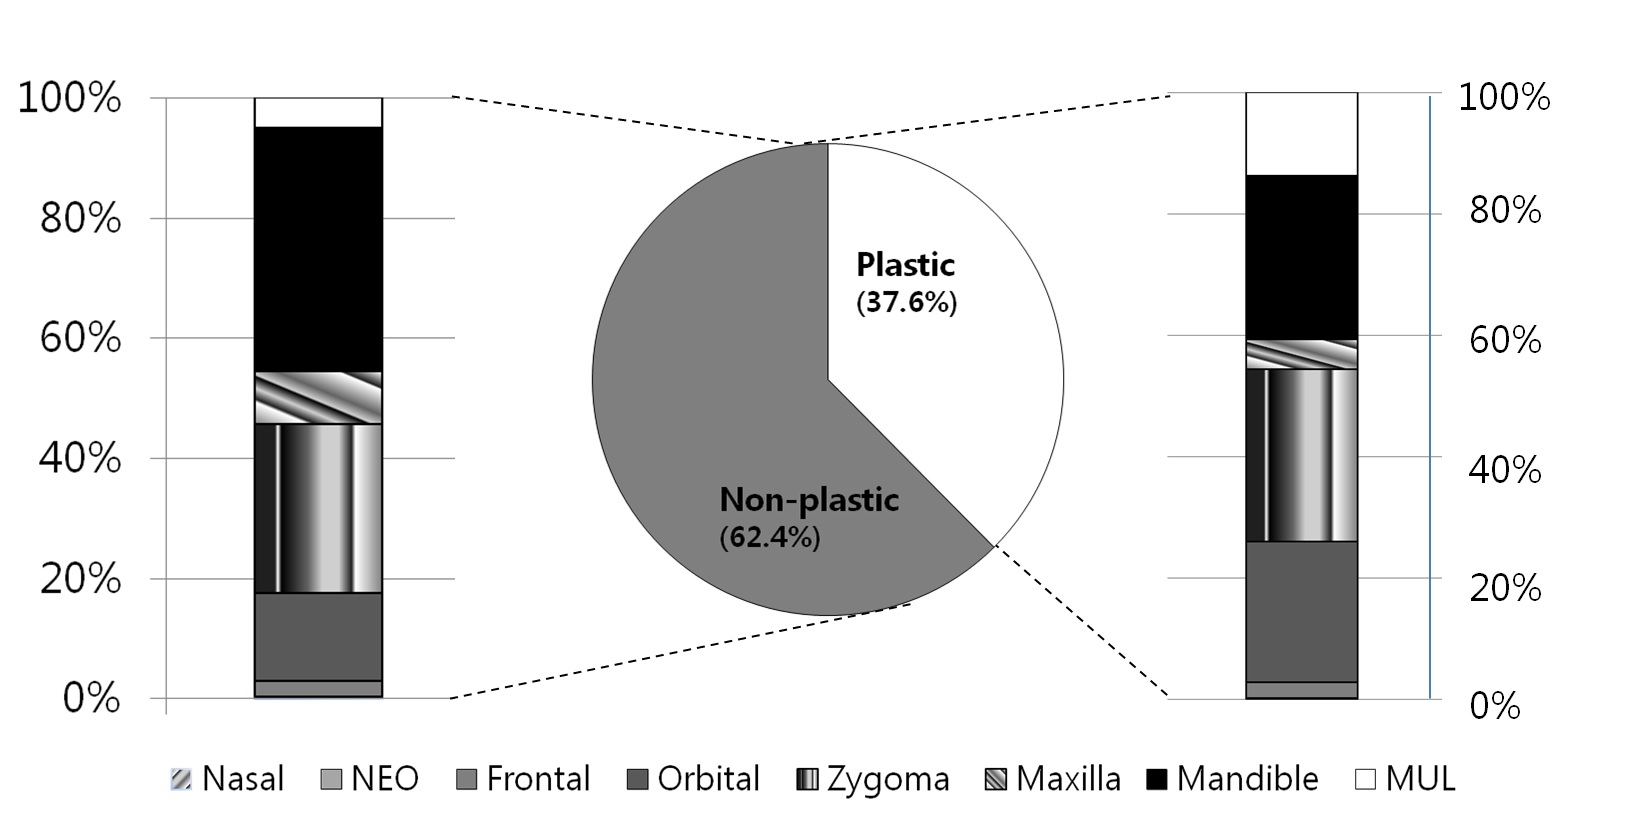
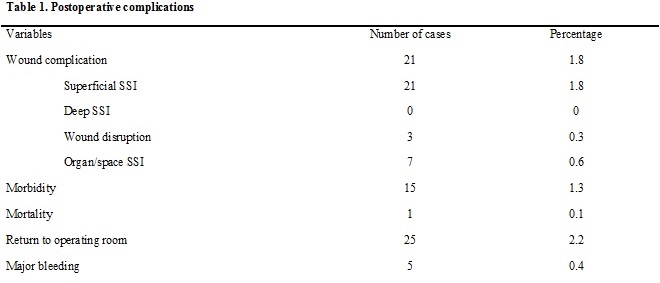
A total of 1,170 patients were analyzed. Mean age was 38.7 ±17.0 and the ratio of males to females was 3.72: 1. The most prevalent facial fracture was mandibular fracture in the single fracture group and zygomatic fracture in multiple fracture group. Mandibular fractures were more prevalent in males and orbital fractures in females. Wound complications, and morbidity and mortality rates were 1.8%, 1.3% and 0.1% respectively. There were no significant differences in epidemiologic data and complication rates between those treated by plastic surgeons and those by non-plastic surgeons.
Conclusion:
Epidemiologic analysis of facial fractures identifies the most affected patient populations and the characteristics of their fractures. Comparison of complication rates and surgical specialty permit an accurate interpretation of how patients are currently managed.


Figure Legend:
Figure 1. Distribution ratio of fracture types within the single and multiple fracture groups
Figure 2. Distribution of fractures treated by plastic surgeons and non-plastic surgeons
Table 1. Postoperative complications
Back to Annual Meeting
|


