|
Back to Annual Meeting
Modeling Fade Patterns of Nipple Areola Tattoos Following Breast Reconstruction
Heather A. Levites, Mitchell S. Fourman, M. Phil., Brett T. Phillips, MD, Indira M. Fromm, Sami U. Khan, MD, Alexander B. Dagum, MD, Duc T. Bui, MD.
Stony Brook University Medical Center, Stony Brook, NY, USA.
BACKGROUND: Nipple-Areolar Complex (NAC) tattoos are an effective cosmetic solution for creating a finished look following breast reconstruction procedures. However, NAC tattoos are prone to significant fading over time, leading to patients to seek revisions. This study was designed to quantify changes in NAC tattoo appearance over time (Figure 1).
METHODS: A total of 71 frontal images of NAC tattoos taken from January 2007- January 2013 from 39 patients were analyzed retrospectively. Each image was analyzed for color and shape by 5 blinded graders using a novel customized scoring system. Subsequently, each image was analyzed using ColorPic software (Iconico, New York). Red/Green/Blue (RGB) and Hue/Saturation/Value (HSV) color parameters were collected from each image at 2 locations- the center of the tattooed nipple and a medial point on the patient’s skin near the tattooed area. Color quantities were normalized to the skin tone in order to control for variability in lighting. Spearman correlations and non-linear regressions were calculated in Graphpad Prism version 6.0 for Windows, (Graphpad, La-Jolla CA).
RESULTS: The length of time after most recent tattoo placement inversely correlated with color score (p<0.0001, 95% confidence interval -0.75 to -0.45) and shape score (p=0.0007, 95% confidence interval -0.58 to -0.17). The time following tattoo placement was found to inversely correlate with all recorded color properties (Table 1). Additionally, patient skin saturation negatively correlated with tattoo saturation (normalized to skin) over time (p=0.041). All individual color parameters fit one-phase exponential decay models (Figure 2). Coefficients of the one-phase decay are reported in Table 2. The numbers of days to 1, 2, 3 and 4 half-lives for each of the six color descriptors are reported in Table 3.
CONCULSIONS: The observational findings show that as time passes, the aesthetic quality of the color and shape of the tattoo decline. Based on the one phase decay models, the color qualities of the tattoo approach those of the patient’s skin over time, ultimately reaching a plateau. The half-life of the decay models can also provide valuable clinical insight as to when the tattoo has stabilized. In practice, tattoo colors may be selected that compensate for the inevitable changes that will occur. The results of this study help optimize tattoo color and alleviate the need for NAC tattoo revisions.
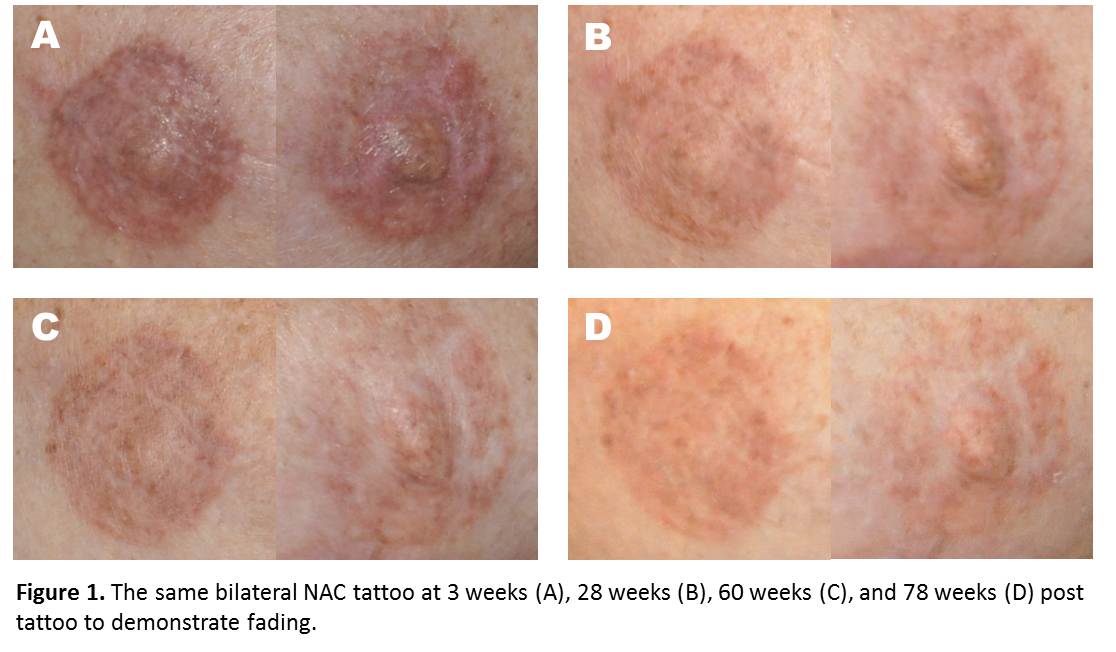
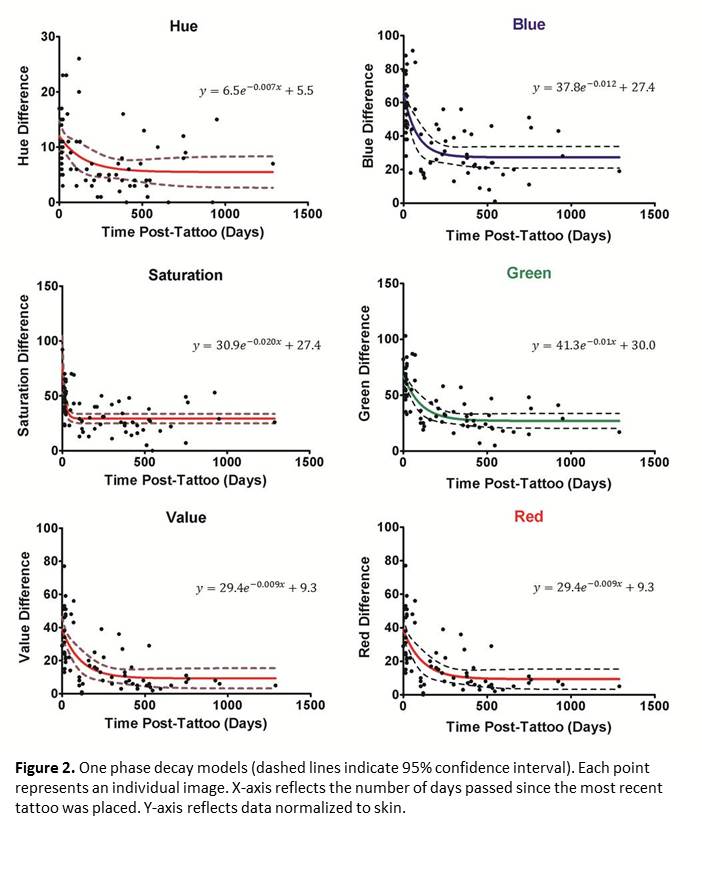
Table 1. Correlations between Color and Time (*time in days) | 95% confidence interval | P (two-tailed) | | Hue | -0.60 to -0.20 | 0.0002 | | Saturation | -0.67 to -0.31 | < 0.0001 | | Value | -0.80 to -0.54 | < 0.0001 | | Red | -0.80 to -0.54 | < 0.0001 | | Blue | -0.82 to -0.58 | < 0.0001 | | Green | -0.75 to -0.45 | < 0.0001 |
Table 2. One Phase Decay | Y0 | Plateau | K | Half Life | Tau | Span | R Square | | Hue | 12.030 | 5.494 | 0.007 | 100.100 | 144.500 | 6.536 | 0.187 | | Saturation | 58.270 | 27.420 | 0.020 | 33.970 | 49.000 | 30.850 | 0.344 | | Value | 38.720 | 9.304 | 0.009 | 77.500 | 111.800 | 29.420 | 0.421 | | Red | 38.720 | 9.304 | 0.009 | 77.500 | 111.800 | 29.420 | 0.421 | | Blue | 68.280 | 26.990 | 0.010 | 70.660 | 101.900 | 41.290 | 0.516 | | Green | 65.150 | 27.350 | 0.012 | 55.510 | 80.090 | 37.800 | 0.423 |
Table 3. Color Property Decay (*time in days) | t1/2 (50%) | 2t1/2 (75%) | 3t1/2 (87.5%) | 4t1/2 (93.75%) | | Hue | 100.10 | 200.20 | 300.30 | 400.40 | | Saturation | 33.97 | 67.94 | 101.91 | 135.88 | | Value | 77.50 | 155.00 | 232.50 | 310.00 | | Red | 77.50 | 155.00 | 232.50 | 310.00 | | Blue | 70.66 | 141.32 | 211.98 | 282.64 | | Green | 55.51 | 111.02 | 166.53 | 222.04 |
Back to Annual Meeting
|


